Bitcoin Cycle On Schedule: Price Lines Up With Previous Cycles

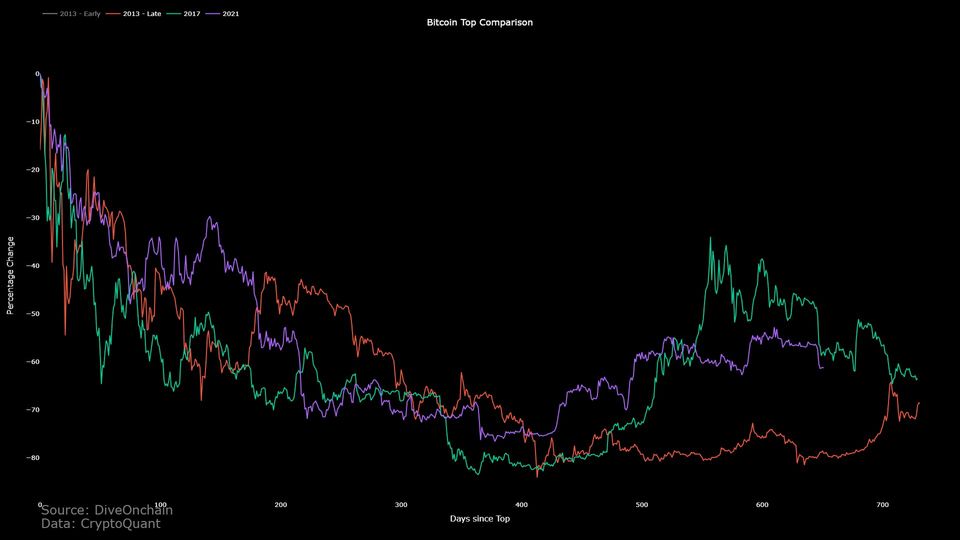
The comparison between the current Bitcoin price and its past cycles reveals intriguing patterns. The analysis, conducted by CryptoQuant Netherlands' community manager Maartunn, focuses on the post-all-time-high bear market periods of previous cycles. By examining percentage changes in price, a notable similarity emerges, especially during the bear market drawdown phase. While there are minor divergences due to short-term fluctuations, the alignment becomes more pronounced around the cyclical bottoms, suggesting a consistent underlying relationship between these cycles.
Interestingly, the recent Bitcoin price crash appears to closely coincide with a sharp drawdown observed during the 2017 cycle. Even though the 2013 cycle displayed a distinct trajectory, it also experienced a significant decline not long before the crashes in the other two cycles. This historical context suggests the possibility of further price drawdown if the current cycle follows similar patterns.
An additional perspective is provided by analyst Root, who has highlighted the short-term holder cost basis level. This level represents the price at which the average short-term holder acquired their coins. Notably, the comparison chart indicates that each cycle experienced periods below this level in the year leading up to the halving. This implies that the current Bitcoin cycle's behavior, including the recent crash below the short-term holder cost basis, falls within the realm of historical precedent.
As of the latest data, Bitcoin's trading value stands at approximately $26,400, reflecting a 7% decline over the course of the last week. These observations provide insight into how the current cycle aligns with past trends and potential implications for future price movements.

FedEx Corp. (FDX) Price Above $250, Is it the Right Time To Buy?
The stock price of FedEx Corporation (FDX) has been surging within a rising parallel channel on its daily charts. The price movement indicates significant....
upward momentum, with the stock extending its gains. This surge comes after a breakout above the neckline around $240, driven by positive sentiment from Q2 earnings.
Buyers have displayed strength and continued to accumulate shares, resulting in a substantial increase in the stock's value. The chart's bullish structure suggests a potential path towards $300 in the coming sessions. Since the beginning of 2023, FDX stock has been on an upward trajectory, and it currently aims for the $300 target. In case of a correction, the immediate support level lies around $240.
As of now, the FDX stock price is $260.45, representing a 0.57% intraday gain. The trading volume has increased by 0.34% to 1.787 million, and the market capitalization stands at $65.506 billion. Analysts have given the stock a neutral rating, and its current price is close to the yearly target of $266.78.
About FedEx Corporation
FedEx Corp. is a holding company that offers transportation, e-commerce, business services, and solutions. It operates through segments like FedEx Express, FedEx Ground, FedEx Freight, FedEx Services, and Corporate, Other, and Eliminations.
Technical Analysis and Price Outlook
FDX stock has witnessed a substantial rally from its low of $150 to its current level of $260, marking over a 60% gain in recent months. The technical analysis suggests that if the price continues to stay above $260, particularly near the 50-day EMA (Exponential Moving Average), it could potentially reach $280 and even $300 in the near future.
The Relative Strength Index (RSI) indicates a bullish divergence, implying a potential surge in upcoming sessions. The Moving Average Convergence Divergence (MACD) indicator shows a bearish crossover, but the lack of significant selling pressure, as indicated by the histogram's red bars, suggests a state of neutrality.
Conclusion
FDX stock is currently experiencing a bullish trajectory within a rising channel, with buyers driving its gains. The technical analysis points to the continuation of this rally towards the $300 mark. Support levels lie at $250 and $240, while resistance levels are at $270 and $280. As with any investment, it's essential to note that trading or investing in stocks carries a risk of financial loss. This analysis does not constitute financial advice.

Why Nvidia’s 20% Rise Ignited Rally In Crypto AI Tokens
Crypto tokens with AI applications are outperforming other assets, with Nvidia, a chipmaking giant, reaching a historic high due to its successful bet on the AI sector. AI-based cryptocurrencies like Render (RNDR) and Akash Network have recently seen double-digit gains. The correlation between Nvidia and crypto AI tokens is strong, as Nvidia's leadership in AI has driven interest in this technology. The positive response of AI-powered cryptocurrencies to Nvidia's impressive Q2 earnings suggests a symbiotic relationship. Nvidia's projected growth in AI chip sales is expected to boost its revenue and potentially spill over into the crypto sector. This trend aligns with the growing interest in AI among major tech companies. As Nvidia's stock price continues to rise, it serves as a potential indicator of AI crypto token performance. If predictions hold, Nvidia's stock price could double by year-end, prompting speculation about the future of crypto AI tokens.
